
Equity Explorer – Agarwal Toughened Glass India Limited

AGARWAL TOUGHENED GLASS INDIA LIMITED
1. Company Profile, Business Model and Product Portfolio
Agarwal Toughened Glass India Limited is a Jaipur-based architectural and safety-glass processor. It purchases annealed float-glass sheets and converts them through cutting, edge grinding, washing, tempering, quenching, lamination, insulation and optional value-added treatments. The business therefore sits downstream from primary float-glass manufacturers and closer to fabricators, façade contractors, builders, institutions and end-project customers. ATGIL processes float glass into toughened, insulated, laminated and heat-soaked safety glass for commercial real estate, infrastructure, hospitality, and healthcare, institutional and interior applications. The company has built a strong regional processing platform in Rajasthan, shifted its mix toward higher-value products and reported rapid FY26 scaling.
Product portfolio:
| Product | Typical applications | Commercial characteristics |
| Toughened glass | Façades, curtain walls, railings, shower doors, doors, table tops and shelves | Core volume product; safety and strength; competitive processing market. |
| DGU / IGU | Energy-efficient façades, windows, partitions and noise reduction | Higher value addition; benefits from green-building and energy-efficiency demand. |
| Laminated safety glass | Railings, skylights, sound insulation, UV protection and impact safety | Premium product; interlayer retains fragments and improves safety/acoustics. |
| Heat-soaked glass | High-risk areas where spontaneous breakage must be minimised | Additional testing process; important for premium façades and safety-critical projects. |
| Other value-added glass | Frosted, tinted, reflective, ceramic/digital printing and customised products | Can improve realisation and customer stickiness but demands process control and low rejection. |
Business strengths:
• Architectural processed-glass demand is linked to commercial real estate, premium residential construction, hospitals, airports, hotels, public infrastructure, façade refurbishment and stricter safety/energy norms. Entry barriers are moderate at the basic tempering level but increase for jumbo sizes, low-E coatings, high-quality IGUs, laminates, heat-soaking, complex shapes, certifications and consistent project execution. Customer qualification, yield, breakage control and logistics are as important as installed capacity.
• Large-format capability, including laminated glass up to 3,000 x 6,000 mm and jumbo toughened-glass processing.
• Quality and processor credentials cited for ISO 9001:2015, BIS IS 2553, Saint-Gobain, Asahi India Glass and Gujarat Guardian products.
• Customer references include Power Grid, DLF Midtown, Genpact, JECC, hospitals, hotels, institutions and corporates. These references demonstrate qualification history but should not be interpreted as recurring contracts unless separately disclosed.
• Owned logistics fleet and regional manufacturing base can improve handling reliability for fragile, customised products.
2. Manufacturing Footprint, Capacity and Growth Strategy
| Facility / product | Installed capacity | Reported utilisation | Observation |
| Unit 1 – Toughened glass | 612,000 sq. m. | 57.34% | Existing capacity offers headroom before full saturation. |
| Unit 1 – IGU | 90,000 sq. m. | 47.73% | Value-added line; utilisation can improve with commercial façade orders. |
| Unit 2 – Toughened glass | 1,080,000 sq. m. | 46.57%* | Large scale relative to current revenue; the presentation is ambiguous on whether utilisation relates only to toughened glass or the unit overall. |
| Unit 2 – IGU | 90,000 sq. m. | Requires better disclosure of line-level utilisation and yields. | |
| Unit 3 / new facility | Capacity equal to Unit 2 | NA | Rs 24-30 crore; key driver of future volume and fixed-cost absorption. |
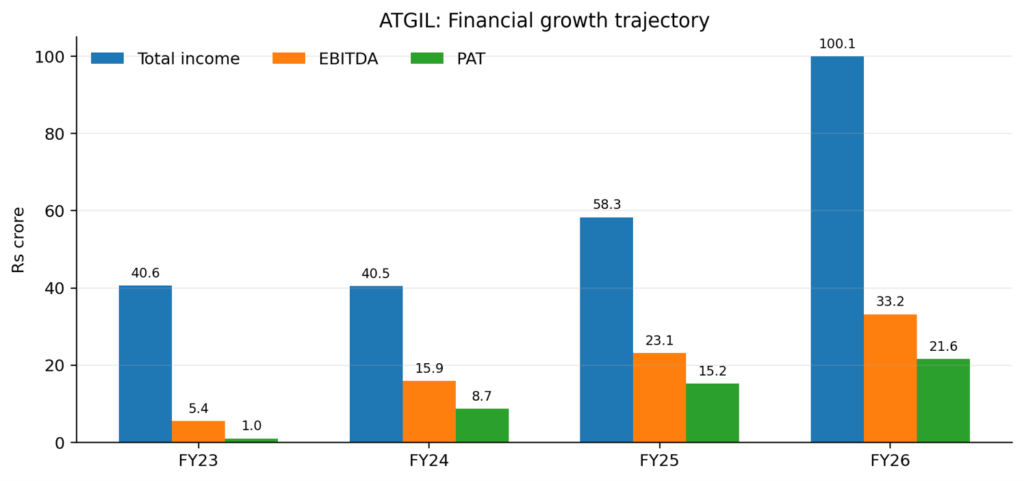
| Rs crore / metric | FY23 | FY24 | FY25 | FY26 | FY26 YoY |
| Total income | 40.60 | 40.50 | 58.30 | 100.06 | 71.6% |
| EBITDA | 5.44 | 15.88 | 23.12 | 33.20 | 43.6% |
| EBITDA margin | 13.3% | 39.2% | 39.7% | 33.2% | (6.5 ppt) |
| PAT | 0.97 | 8.69 | 15.17 | 21.60 | 42.4% |
| PAT margin | 2.4% | 21.5% | 26.0% | 21.6% | (4.4 ppt) |
| EPS (Rs) | 0.82 | 7.31 | 8.58 | 12.22 | 42.4% |
4. Balance Sheet, Working Capital and Cash-Flow Quality
| Rs 115.83 Cr FY26 net worth | Rs 24.67 Cr Total borrowings | Rs 10.65 Cr Cash & bank | Rs 14.03 Cr Net debt |
| 0.21x Debt / equity | Rs 29.41 Cr Inventory | Rs 34.54 Cr Receivables | Rs 36.60 Cr Short-term loans & advances |
Total borrowings of Rs 24.67 crore against net worth of Rs 115.83 crore produce a debt/equity ratio of about 0.21x. The equity base was strengthened by the SME IPO and retained profits. Liquidity nevertheless deserves closer attention because receivables, inventory and short-term loans/advances together represented more than Rs 100 crore at March 2026, a large amount relative to annual revenue.
Preferential issue and dilution
The company has proposed up to 17.46 lakh equity shares and 46.80 lakh warrants at Rs 109 each, aggregating to Rs 70.04 crore. Warrants require 25% upfront and the balance upon exercise within 18 months. The fully diluted share count would rise from approximately 1.767 crore to 2.410 crore, an increase of about 36.4%. Promoter holding is indicated to reduce from 64.16% pre-issue to 58.43% on full dilution. Proceeds are intended for capex, working capital and general corporate purposes.
5. Executive Summary and Investment Framework
| Key growth catalysts • Ramp-up of the third manufacturing facility and better absorption of fixed costs. • Further shift toward laminated, DGU/IGU, heat-soaked and customized products. • Expansion from five marketing offices toward the proposed national network. • Potential growth through other value added glass opportunity, subject to technology, certification and customer validation. | Key risks / reasons for discount • Negative FY26 operating cash flow despite strong PAT; high receivables, inventory and short-term advances. • High FY25/FY26 margins may change as scale grows, competitive intensity rises or mix changes. |
6. Peer Comparison: Agarwal Toughened Glass vs Sejal Glass
| Key metric | Agarwal Toughened Glass India | Sejal Glass Limited |
| Business footprint | Jaipur manufacturing base; architectural and safety-glass processing | India plus substantial UAE operations; multiple Indian facilities |
| FY26 total income | Rs 100.06 Cr | Rs 401.36 Cr |
| FY26 EBITDA | Rs 33.20 Cr | Rs 66.32 Cr |
| FY26 EBITDA margin | 33.2% | 16.50% |
| FY26 PAT | Rs 21.60 Cr | Rs 29.03 Cr |
| FY26 PAT margin | 21.60% | 7.20% |
| Diluted EPS | Rs 12.22 pre-preferential dilution | Rs 27.12 |
| Operating cash flow | Negative Rs 8.50 Cr | Positive Rs 51 Cr |
| Borrowings | Rs 24.67 Cr | 202 Cr |
| ROCE / ROE | 23.0% / 20.6% | 18.3% / 30.4% |
| Market capitalisation | Rs 223 Cr | Rs 849 Cr |
| P/E | 14.1x on fully diluted basis | 29.6x |
| Promoter holding | 58.43% on fully diluted basis | 69.96% |
[The above article is written for educational purposes only and makes no comment on the any investment decision. Readers are advised to do their due research and consult their advisor before taken any investment decision. The author can be reached at dhruvsbheda@gmail.com]