
DOUBLE TOP PATTERN (M SHAPE STRUCTURE)
Double top patterns are important technical trading structures to learn and integrate into a trader’s arsenal. Double tops can enhance technical analysis when trading both Index or stocks, making the pattern highly versatile in nature.
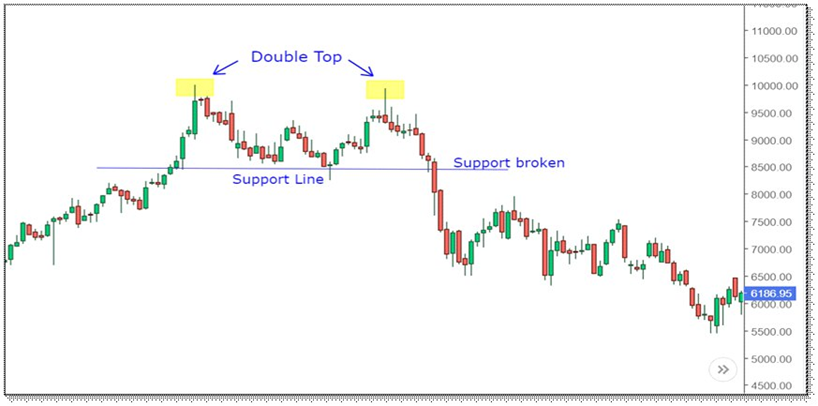
A double top is an extremely bearish technical reversal pattern that forms after an asset reaches a high price two consecutive times with a moderate decline between the two highs. It is confirmed once the asset’s price falls below a support level equal to the low between the two prior highs. The double top pattern entails two high points within a market which signifies an impending bearish reversal signal. A measured decline in price will occur between the two high points, showing some resistance at the price highs. After retracing a portion of the first peak, the market rallies back towards the high of the first peak however, strength in the market is decreasing and is unable to sustain a break above the first peak.
How to Identify Double Top Pattern on Chart?
- Identify the two distinct peaks of similar width and height
- Distance between peaks should not be too small – time frame dependent
- Confirm neckline/support price level
- Use technical indicators to support double top bearish signal, such as moving averages and oscillators
How to Trade with Double Top ?
- Firstly, one should see the market phase whether it is up or down. As the double top is formed at the end of an uptrend, the prior trend should be an uptrend.
- Traders should spot if two rounding tops are forming and also note the size of the tops.
- Traders should only enter the short position when the price break out from the support level or the neckline. In this case, the stop loss should be placed at the second top of the pattern. The price target should be equal to the distance between the neckline and the tops.
What is difference Between a Double Top and a Failed Double Top ?
There is indeed a significant difference between a double top and one that has failed. A real double top is an extremely bearish technical pattern which can lead to an extremely sharp decline in a stock or asset. However, it is essential to be patient and identify the critical support level to confirm a double top’s identity. Basing a double top solely on the formation of two consecutive peaks could lead to a false reading and cause an early exit from a position.
A double top has an ‘M’ shape and indicates a bearish reversal in trend.


Key Points to remember:
- A double top is a bearish reversal chart pattern that is formed after an uptrend
- A double bottom is a bullish reversal chart pattern that is formed after the downtrend.
- Traders should always use double top chart pattern with other indicators like Volumes, RSI, moving averages etc for confirming the reversal before taking a position